RU

Revenue

In 2015, the Company’s revenue from all types of activities amounted to RUB 181.2 billion, down 2.4% year-on-year, despite a 9% decline in passenger turnover.

Changes in revenue from core services, RUB billion

Changes in revenue from core services, RUB billion

Indicator 2013 2014 2015 % of 2014 level % vs 2013
Revenue 196.1 185.6 181.2 97.6 92.4
Passenger revenue 175.4 164.2 160.0 97.4 91.2
in the deregulated segment 88.5 79.3 73.9 93.2 83.5
in first class and compartment carriages 59.5 59.4 58.5 98.4 98.3
international services 29.1 19.8 15.4 77.6 53.0
in the regulated state segment 86.8 85.0 86.1 101.4 99.2
from passenger services 77.7 76.8 79.3 103.1 102.0
in third class carriages 75.1 73.7 74.8 101.5 99.6
in common carriages 2.6 3.1 4.5 142.6 172.4
from baggage, unaccompanied baggage, and mail transportation 9.2 8.1 6.9 84.7 75.0
Revenue from other activities 20.7 21.4 21.2 99.3 102.5
repair and maintenance of clients’ rolling stock 2.4 2.3 2.2 97.9 92.5
provision of additional services on trains 11.6 11.6 11.3 97.2 97.1
premium services 2.5 3.0 2.9 99.4 118.7
bed sheets on trains 8.1 7.7 7.7 99.5 95.3
tea, confectionery and printed media sales 1.0 0.9 0.6 69.5 59.9
other lines of business (property lease to third parties, agency fees under contracts) 6.7 7.5 7.8 103.1 115.3

Passenger Revenue

In 2015, revenue from passenger services amounted to RUB 160.0 billion, down 2.6% year-on-year.

Revenue in the deregulated segment was RUB 73.9 billion, down 6.8% year-on-year.

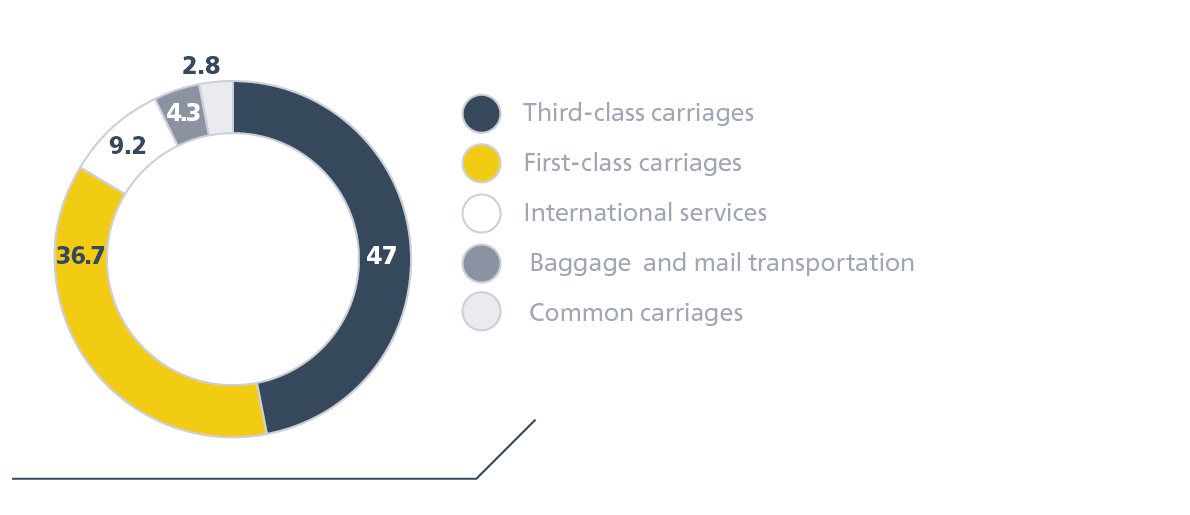
Domestic traffic generated the revenue of RUB 58.5 billion. A 1.6% decrease on the previous year was due to a 9.9% decline in passenger turnover in the segment and fare indexation by 5%.

A decline in international traffic both on the Company’s trains (down 55.1% year-on-year) and trains made up in the CIS and Baltic states (down 30.3% year-on-year), including due to cancellation of FPC trains running to Ukraine, led to a decline in international passenger revenue by 22.4% year-on-year.

Revenue in the regulated segment totalled RUB 86.1 billion, up 1.4% year-on-year.

Revenue from passenger services in third-class and common carriages reached RUB 79.2 billion. A 3.1% growth year-on-year was due to the fare indexation by 10%, while passenger turnover in this segment declined by 3.3%.

Revenue from baggage, unaccompanied baggage, and mail transportation totalled RUB 6.9 billion. A 15.3% decrease vs 2014 level was due to a decline in baggage and unaccompanied baggage turnover in the Company’s own and leased baggage carriages by 37.8% year-on-year and tariff indexation by 10%.

Breakdown of passenger revenue, %

Revenue from Other Activities

Other activities include repairs of clients’ rolling stock, provision of additional services on trains, rolling stock and real estate lease to third parties, and other services.

In 2015, revenue from other activities totalled RUB 21.2 billion, down 0.7% year-on-year.

At the same time, in 2015, the demand for carriages leased to third-party clients was up 13% from the actual 2014 level, driving a considerable improvement in revenue from other sales in 2015.

In 2015, revenue from other activities accounted for about 11.7% of the total revenue, against 11.5% in 2014.

As part of the efforts to enhance the quality of services provided by FPC and boost other sales, the following measures were implemented in 2015:

  • internet access and access to the portal with a Wi-Fi cinema provided on FPC trains;
  • goods purchasing, inventory management and dispensing of on-board supplies outsourced to third-party partners. The transition to new arrangements for interaction with suppliers of goods sold on trains has driven the financial result from other activities.

Breakdown of revenue from other activities, RUB billion