

In 2015, operating expenses amounted to RUB 199.0 billion, down 2.9% year-on-year.
Payroll costs amounted to RUB 30.8 billion, which is 99.1% of the previous year’s level. Expenses on materials amounted to RUB 7.5 billion, or less than 88.1% of the 2014 level. Savings came from cost optimisation and reduced costs of rolling stock repair and maintenance achieved through the use of reusable materials in production.
Fuel and electricity costs totalled RUB 1.2 billion, down 11.2% year-on-year. Fuel and electricity consumption was reduced by 9.955 t c.e., including through measures to optimise the consumption of electricity and fuel resources.
Other material costs totalled RUB 25.9 billion, demonstrating a 13.4% reduction year-on-year. Cost optimisation measures enabled the reduction of passenger carriage repair, maintenance and preparation costs.
Depreciation charges were RUB 13.8 billion, down 3.2% year-on-year.
Other costs amounted to RUB 111.5 billion.
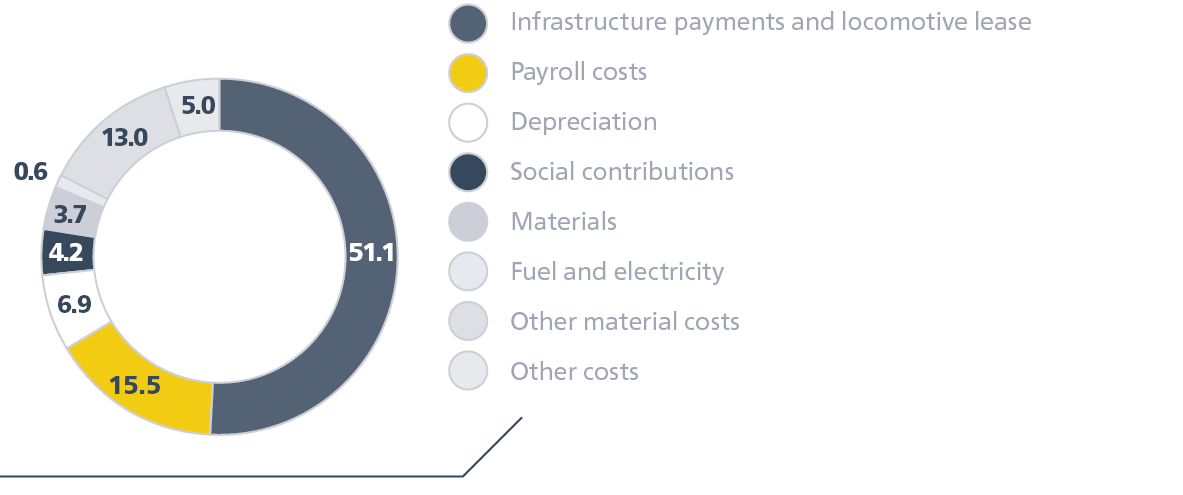
Expenses breakdown, RUB billion
| Indicator | 2013 | 2014 | 2015 | % of 2014 |
|---|---|---|---|---|
| Payroll costs | 31.1 | 31.1 | 30.8 | 99.1 |
| Social contributions | 8.5 | 8.5 | 8.4 | 99.0 |
| Materials | 8.0 | 8.4 | 7.5 | 88.1 |
| Fuel | 1.0 | 0.9 | 0.8 | 84.8 |
| Electricity | 0.38 | 0.39 | 0.39 | 98.4 |
| Other material costs | 31.8 | 29.9 | 25.9 | 86.6 |
| Other | 113.5 | 111.5 | 111.5 | 100.0 |
| expenses on infrastructure services and locomotive lease | 103.0 | 101.7 | 101.7 | 100.0 |
| Depreciation | 14.4 | 14.2 | 13.8 | 96.8 |
| Expenses, total | 208.7 | 204.9 | 199.0 | 97.1 |